Table 1 Ca/P ratios of each group
Group | Number of observations | Mean ± SD |
|---|---|---|
Group A (CPPACP) | 5 | 1.58 ± 0.05bc |
Group B (TPP + CPPACP) | 5 | 1.61 ± 0.04c |
Group C (artificial saliva) | 5 | 1.52 ± 0.03ab |
Group D (negative) | 5 | 1.49 ± 0.04a |
Group E (positive) | 5 | 1.64 ± 0.03c |
- The difference between Group B and Group E is not statistically significant (P > 0.05), while differences between Group B and Group C, between Group B and Group D and between Group A and Group D are statistically significant (P < 0.05)
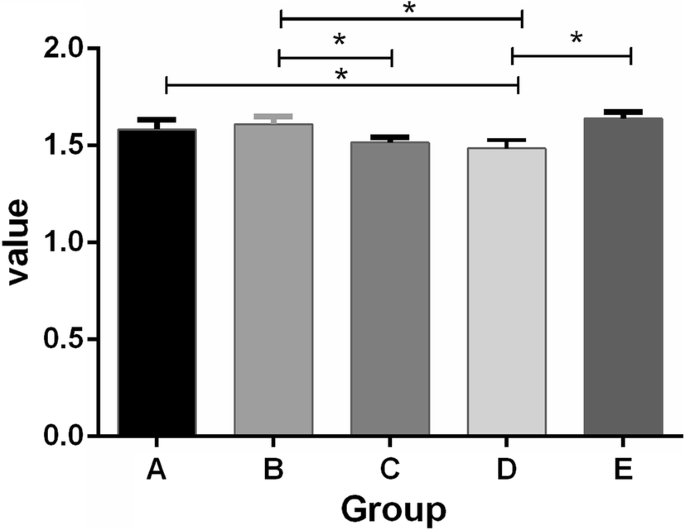
- * P < 0.05
- Comparasion of Ca/P ratios in each group. The difference between Group B and Group E is not statistically significant (P > 0.05), while differences between Group B and Group C, between Group B and Group D and between Group A and Group D are statistically significant (P < 0.05)
- a–cThere was no statistical significant difference between the groups marked with the same footnote
